Electricity prices paid by many residential and small business customers in New South Wales, South Australia, South East Queensland and Victoria fell between 2018 and 2019, the ACCC’s analysis of extensive data from over 8.5 million bills has shown, according to its latest electricity markets report.
The new data from the bills of over 1.5 million customers of 11 electricity retailers shows that there are now more customers on market offers, and fewer on the usually more expensive default standing offers.
“While it is still early days, the analysis of this large unique dataset indicates that electricity pricing and advertising reforms introduced in July last year have been effective in protecting customers on standing offers from excessive pricing and bringing down electricity bills,” ACCC Chair Rod Sims said.
The ACCC has also released an additional report examining the impact of COVID-19 on affordability and consumption.
The impact of COVID-19 on electricity affordability and consumption
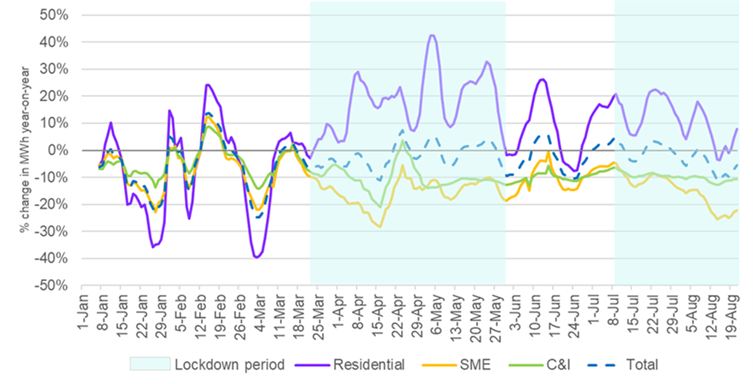
“The supplementary report shows that overall electricity consumption fell by 2 per cent in the second quarter of 2020, compared to the same time last year. Residential consumption rose significantly during the nationwide COVID-19 lockdowns, and because of colder weather in some states, while business consumption plummeted,” Mr Sims said.
For example, Melbourne residential electricity consumption rose by between 10 and 30 per cent in April and May 2020, depending on the weather, compared to the same period in 2019.
“The pandemic is exacerbating energy affordability concerns. At a time when many consumers are experiencing reduced incomes, increased electricity consumption could lead to rising household debt and financial strain,” Mr Sims said.
“Available data suggests more customers are a month behind in bill payments and energy affordability may become an even bigger concern in coming months.”
Wholesale prices staying low
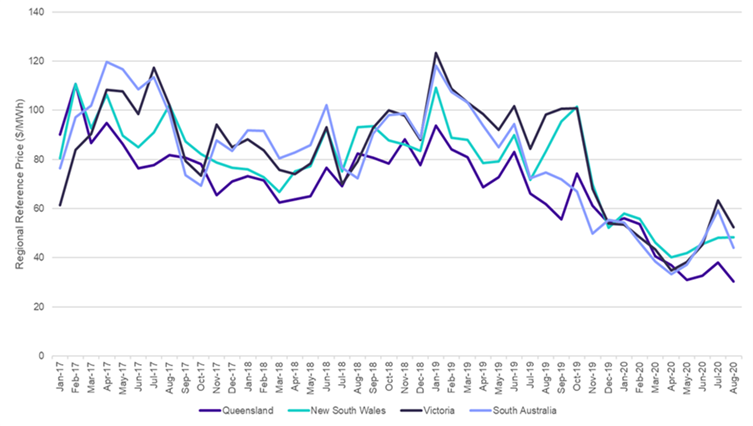
Wholesale spot market electricity prices have been falling since the first quarter of 2019, when they reached a peak of between $89 per MWh in Queensland and $220 per MWh in South Australia. This year’s average winter spot prices in the NEM ranged between $36 per MWh in Queensland and $59 per MWh in Victoria while future contract prices remain low.
“The drop in wholesale prices is excellent news for consumers, especially at a time of rising household bills. While wholesale price falls have been partially offset by higher network costs (except in South Australia where network costs fell), retailers are legally required to pass on any sustained savings to consumers,” Mr Sims said.
“We will continue to monitor prices and, if necessary, enforce the law to ensure consumers benefit from sustained drops in wholesale costs.”
The low wholesale prices are largely due to lower fuel costs for generators and increased renewable generation.
New billing data shows customers are paying lower prices
De-identified data from over 8.5 million bills issued between July 2018 and December 2019 enabled the ACCC to conduct closer analysis of what different customer groups paid for their electricity.
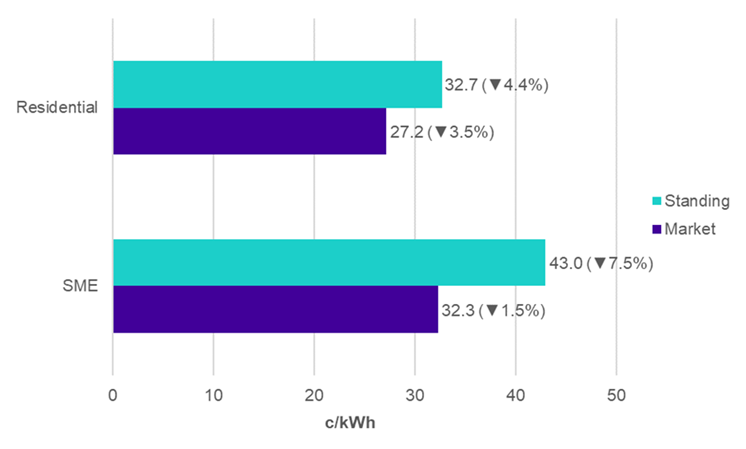
The electricity market report looked at combined data in New South Wales, South Australia, South East Queensland and Victoria for the third quarter of 2019 compared to the same period in 2018. It found that the median effective price paid by customers on standing offers fell by 4.4 per cent (residential) and 7.5 per cent (small business), whereas the median effective price paid by customers on market offers fell by 3.5 per cent (residential) and 1.5 per cent (small business).
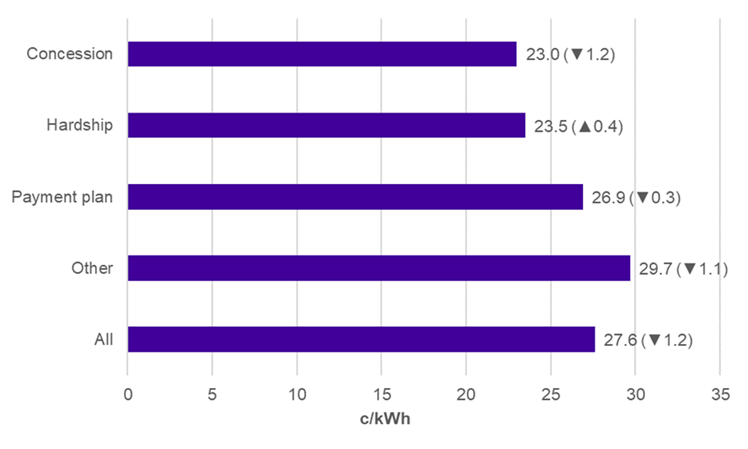
While concession and hardship customers are generally paying lower prices than other residential customers, those who are on payment plans due to financial difficulty are paying more than concession and hardship customers. The electricity market report found that less than 60 per cent of payment plan customers on market offers with conditional discounts, such as paying on time, met the conditions.
“There are still too many customers who do not achieve conditional discounts on these types of plans, which means they pay higher prices that can exacerbate existing financial difficulties. We urge retailers to abide by best practice for their vulnerable customers and help them move to the most suitable electricity plans,” Mr Sims said.
But customers should shop around for further savings
Retail prices paid have fallen for many customers, but the report also finds that the median effective price paid by customers on market offers is lower than that paid by customers on standing offers.
“Residential customers with a median annual electricity usage could save around $219 a year by switching from a standing offer to a market offer, while small businesses on standing offers could save about $424 a year,” Mr Sims said.
“It continues to pay for households and small businesses on market offers to shop around, especially those with one of the big three electricity providers, because these customers often paid more than customers with other providers.”
Under electricity retail pricing and advertising reforms introduced in July 2019, retailers across New South Wales, South Australia, South East Queensland and Victoria are required to show how their offers compare to the Default Market Offer or Victorian Default Offer prices set by the regulator. This enables customers to more easily compare offers across the market.
The ACCC enforces these reforms in New South Wales, South Australia and South East Queensland and in July 2020, Locality Planning Energy became the first electricity provider to pay a penalty for contraventions of the Electricity Retail Code.
“Free government comparison services, like Energy Made Easy and the Victorian Energy Compare, are also an easy way for consumers to compare the annual costs of offers and find the best deal for them,” Mr Sims said.
Solar rebates reduce the price for solar customers
Solar customers paid 24 per cent lower effective prices for electricity from the grid than non-solar customers in 2019, largely because of solar rebates. While solar residential customers tended to use slightly more electricity from the grid, their median bill was $313 pa lower than the bill of non-solar consumers.
“We encourage schemes that improve access to solar systems for lower income households, but non-solar households should not have to shoulder the costs of these schemes,” Mr Sims said.
Background
The National Electricity Market (NEM) is the wholesale electricity market that covers Queensland, New South Wales, Victoria, South Australia, Tasmania and the Australian Capital Territory. This report examined bills for residential and small business customers in New South Wales, South Australia, South East Queensland and Victoria.
Most electricity customers in New South Wales, South Australia, South East Queensland and Victoria are on a market contract or ‘market offer’. Standing offers are applied when a customer does not enter a market contract, and have historically been more expensive than market offers. The electricity retail pricing reforms introduced in July 2019 limit the amount that retailers can charge for standing offers.
In August 2018, the then Treasurer, the Hon Scott Morrison MP, directed the ACCC to hold an inquiry into the prices, profits and margins in relation to the supply of electricity in the NEM. This is the fourth time the ACCC has reported as part of this inquiry, and follows from the reports provided to the Government in March, August and November 2019.
The focus of the September 2020 report is to assess the early effects of the Default Market Offer and Victorian Default Offer reforms implemented to improve affordability in the NEM, based on analysis of a new dataset encompassing over 8.5 million electricity bills.
The supplementary report sets out recent market developments, including some of the effects of the COVID-19 pandemic on electricity used from the grid and updates on our electricity sector monitoring and enforcement work.
Both reports are available on the ACCC’s website at Electricity market monitoring 2018-2025.
The ACCC is required to report at least every 6 months. The next report is scheduled for May 2021.
Figure 1: Year-on-year percentage change in total consumption in Victoria

Source: AusNet Services, Vic DNSP weekly energy consumption data, 28 August 2020
Figure 2: Monthly average underlying (sub $300/MWh) wholesale regional reference prices ($/MWh)

Source: NEM market data
Figure 3: Median effective prices paid by residential and SME standing and market offer customers in 2019 Q3 (percentage change from 2018 Q3) for Victoria, NSW, SA and South East Queensland combined

Source: ACCC analysis of retailer billing data
Figure 4: Median effective prices paid by residential customer groups in 2019 Q3 (change from 2018 Q3) for Victoria, NSW, SA and South East Queensland combined

Source: ACCC analysis of retailer billing data


