January 2023 interim report - Preliminary gas pricing14 Nov 2022
This data reflects the ACCC’s preliminary analysis at this time ahead of the ACCC’s findings in the interim report due in January 2023.
Prices offered for supply in 2023
In reporting on offers made and bids received by suppliers, we included only those offers and bids that contain clear indications of price, quantity, supply start and end dates, and estimate the price for each offer and bid. The analysis of offer and bid prices is intended to provide an indication of price trends over time. Not all offers or bids made result in gas supply agreements (GSAs).
A complete explanation of the ACCC's approach to reporting on prices is presented in appendix B of our Gas Inquiry July 2022 interim report.
Chart 1 shows offers made by producers and retailers for 2023 supply over the period from 1 Jan 2021 to 19 August 2022.
Chart 1 – Gas commodity prices (2023$/GJ) offered in the east coast gas market for 2023 supply
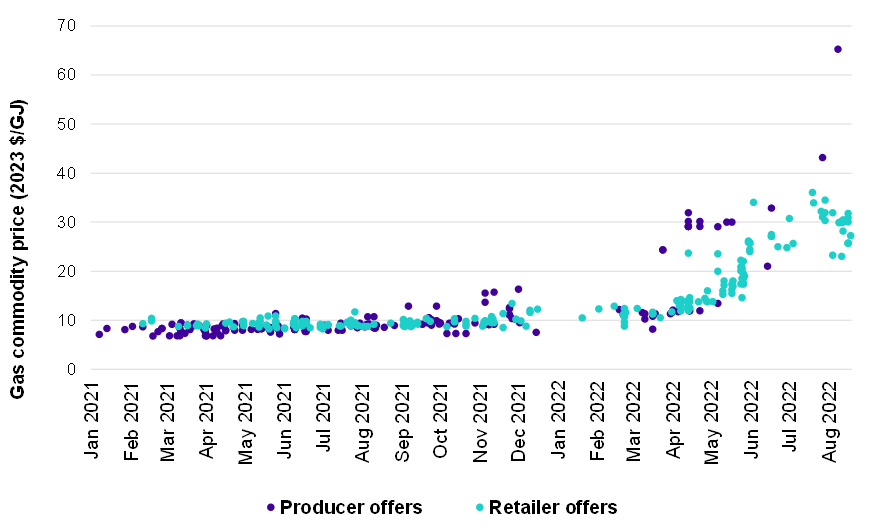
Source: ACCC analysis of bid and offer information provided by suppliers.
Note: Prices are for gas commodity only. Actual prices paid by users may also include transport and retail cost components. All offers are for quantities of at least 0.5PJ per annum and a contract term of at least 12 months. Some offers in the chart may be between the same supplier and buyer and/or represent further offers between parties if a previous offer did not result in the execution of a GSA.
Chart 2 compares offers by producers and retailers for 2023 supply made between 1 January 2021 and 19 August 2022 with:
- Expectations of 2023 short-term LNG netback prices
- Expectations of 2023 medium-term oil linked LNG netback prices
More information can be found on how LNG netback prices are estimated on our ACCC LNG netback price series webpage.
Chart 2 – Gas commodity prices (2023$/GJ) offered in the east coast gas market for 2023 supply compared to expectations of short and medium term LNG netback prices
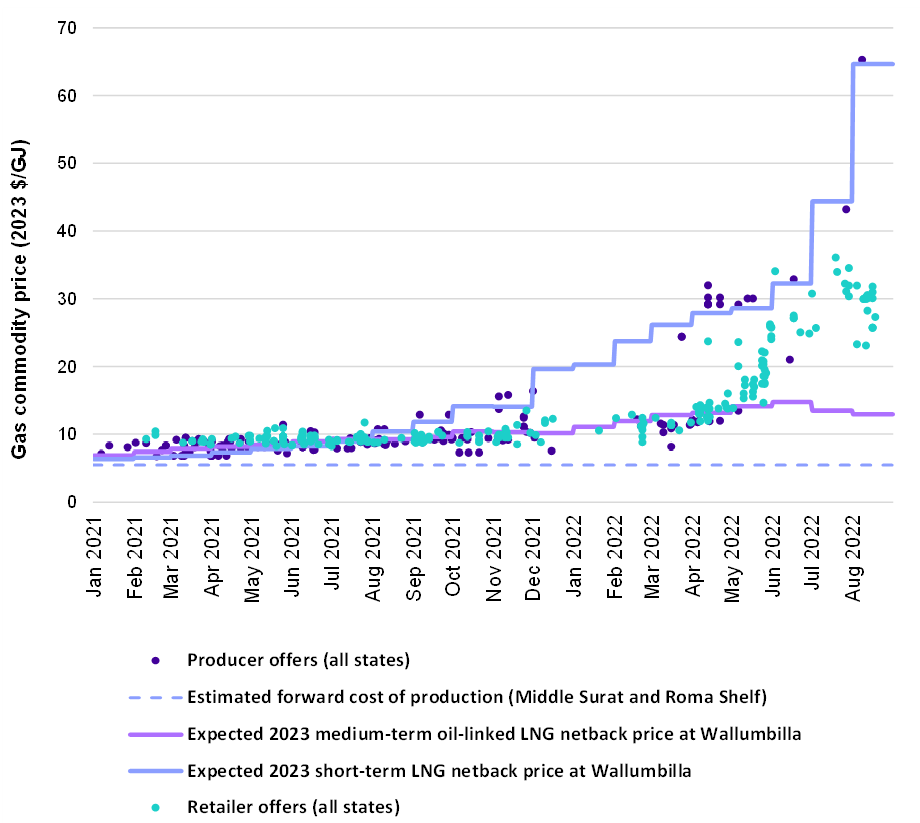
Source: ICE, Argus, ACCC analysis of other information provided by suppliers.
Note: Prices are for gas commodity only. Actual prices paid by users may also include transport and retail cost components. All offers are for quantities of at least 0.5PJ per annum and a contract term of at least 12 months. Some offers in the chart may be between the same supplier and buyer and/or represent further offers between parties if a previous offer did not result in the execution of a GSA.
Chart 3 compares the quantity-weighted average price of offers made or bids received by producers (to all buyers) and by retailers (to all commercial and industrial (C&I) users) for gas supply in 2023 across three periods:
- January 2021 to August 2021
- September 2021 to February 2022
- March 2022 to August 2022
Offers are those prices offered by a producer or retailer to a gas consumer while bids are those prices that a user has proposed to pay to a producer. (Retailers typically supply to retail small business, household users and small to medium C&I users who typically aren't in a position to counterbid an initial offer by the retailer).
Chart 3 – Gas commodity prices (2023$/GJ) offered and bid in the east coast gas market for 2023 supply
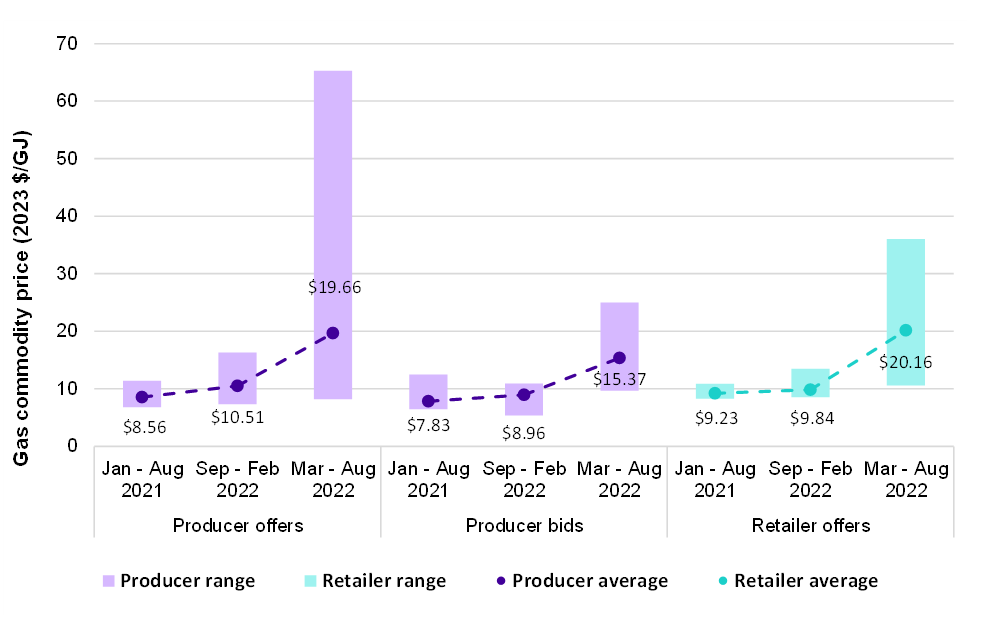
Source: ACCC analysis of bid and offer information provided by suppliers.
Note: Quantity-weighted average prices are displayed next to the point, or below the price range. All bids and offers are for quantities of at least 0.5PJ per annum and a contract term of at least 12 months. Some bids or offers in the chart may be between the same supplier and buyer and/or represent further offers between parties if a previous offer did not result in the execution of a GSA
Prices payable for supply in 2023
Chart 4 presents quantity-weighted average gas prices paid under GSAs entered into by producers and retailers for delivery in the east coast gas market in 2023.
The left-hand side of the chart compares average prices payable under GSAs for gas supplied to customers in the southern states over three periods:
- January 2021 to August 2021
- September 2021 to February 2022
- March 2022 to August 2022
The right-hand side of the chart aggregates these three time periods, in addition to presenting the prices payable under GSAs entered into by producers for delivery in Queensland.
Chart 4 - Gas commodity prices (2023 $/GJ) payable under GSAs in the east coast gas market for 2023 supply
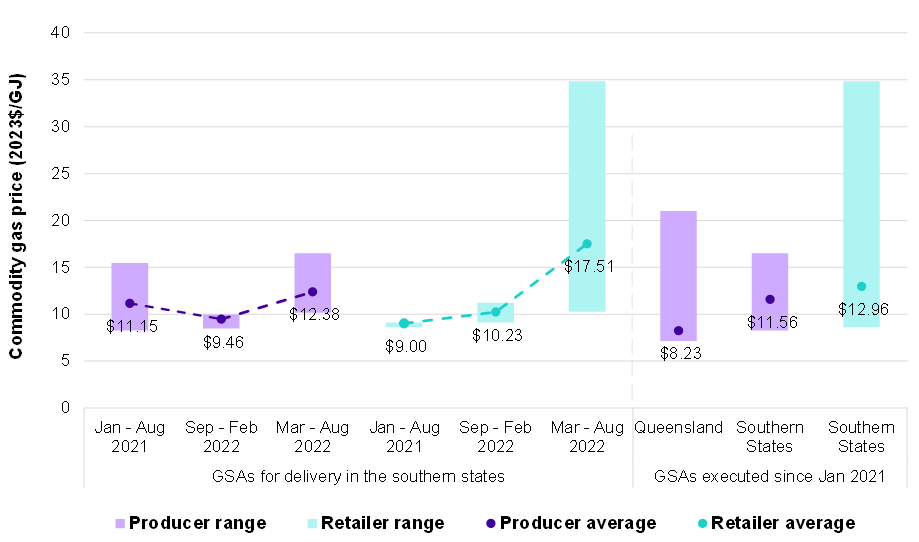
Source: ACCC analysis of GSA information provided by suppliers.
Note: All contracts are for quantities of at least 0.5PJ per annum and a contract term of at least 12 months. Expected prices payable under GSAs executed by retailers in Queensland were excluded from this chart because an insufficient number of GSAs were executed between retailers and C&I users for supply in Queensland. Prices are based on assumptions as at 2 November 2022.