Australian Competition and Consumer Commission analysis of recent petrol price cycles has identified that prices have already peaked in many capital cities, which means that they should be falling at a time when petrol demand is highest.
“Sales of petrol across Australia are at their highest in the latter half of December, so the fact that prices should be decreasing, albeit from high levels, during a period of high demand will be some comfort to motorists,” ACCC Chairman Rod Sims said.
“We will be watching closely, as part of our monitoring role, to see that this occurs and will report accordingly.”
“It is also important to note that as prices fall, the petrol retailers will move prices at different times, so it will pay to shop around,” Mr Sims said.
“Motorists should keep an eye on petrol price movements and use the increasing number of fuel price apps available to help them decide when and where to buy petrol. These apps show that petrol prices do sometimes significantly vary in many buying areas.”
ACCC analysis of petrol sales throughout the year indicates that demand for petrol is higher in the weeks leading up to Christmas but falls significantly afterwards. Demand picks up again in late January. This is clear from the chart below, which shows weekly average sales of regular unleaded petrol across Australia, averaged over the seven-year period 2007-08 to 2013-14.
The ACCC is monitoring petrol prices across Australia, and particularly the petrol price cycles that occur in the larger capital cities.
“Petrol prices peaked in Sydney, Adelaide, and Brisbane in recent weeks and there should not be a petrol price cycle increase in those cities again before Christmas. Prices have been decreasing slowly in Melbourne and we expect them to continue falling. In Perth prices cycles are extremely regular lasting seven days, and we expect that prices will go up Tuesday as usual and be at their cheapest on Monday,” Mr Sims said.
Since the beginning of 2016 a number of fuel price apps have been introduced which provide greater transparency in the petrol market. These include apps from MotorMouth, FuelCheck, NRMA, 7-Eleven, and GasBuddy. These join existing apps, such as those from Woolworths, and United.
“With the exception of Perth, petrol price cycles no longer consist of a weekly price peak and a trough. This can make it difficult for motorists to wait for lower prices before buying petrol. However, by using new pricing apps to shop at petrol retailers that discount, consumers can shop around to find the best deal. This can have a flow-on effect by putting pressure on other retailers to lower prices in their local petrol market,” Mr Sims said.
Background
ACCC analysis shows that petrol price cycles in the eastern capital cities can be quite variable and in past months have ranged from a length of between one to seven weeks. In contrast, in Perth the length of petrol price cycles are regularly seven days, with prices peaking on a Tuesday and being at their lowest on a Monday.
Daily average petrol prices in the five largest cities from 1 October 2016 are shown in the charts below. These are regular unleaded petrol (RULP) prices in all cities except Sydney, which is E10 (because more E10 than RULP is sold in Sydney).
The source of the data in all charts is ACCC calculations based on FUELtrac data.
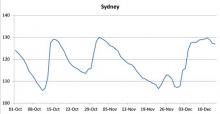
The chart shows daily average E10 petrol prices in Sydney from 1 October 2016. Price cycles in Sydney have been variable in recent months. Over the last five price cycles, the duration of cycles (ie the movement from trough to peak to subsequent trough) has ranged from 7 to 27 days in Sydney. Prices have recently peaked and are not expected to increase again before Christmas.

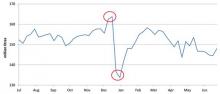
The chart shows daily average RULP in Melbourne from 1 October 2016. Price cycles in Melbourne have been variable in recent months. Over the last five price cycles, the duration of cycles (ie the movement from trough to peak to subsequent trough) has ranged from 26 to 50 days in Melbourne. In Melbourne, prices peaked on 17 November, but have been only slowly decreasing.
We expect this slow decrease to continue in coming weeks. If prices did increase before Christmas, we would expect the increase to not be large.

The chart shows daily average RULP in Brisbane from 1 October 2016. Price cycles in Brisbane have been variable in recent months. Over the last five price cycles, the duration of cycles (ie the movement from trough to peak to subsequent trough) has ranged from 25 to 51 days in Brisbane. Prices have recently peaked and are not expected to increase again before Christmas.

The chart shows daily average RULP in Adelaide from 1 October 2016. Price cycles in Adelaide have been variable in recent months. Over the last five price cycles, the duration of cycles (ie the movement from trough to peak to subsequent trough) has ranged from 19 to 40 days in Adelaide. Prices have recently peaked and are not expected to increase again before Christmas.
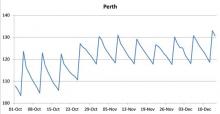
The chart shows daily average RULP in Perth from 1 October 2016. Price cycles in Perth are extremely consistent, with a duration of seven days. Prices are expected to increase on Tuesday as usual.